A parent ordering platform rebuilt from research to launch, so rural optical-store owners could finally place an order.
RoleUI/UX Designer
TeamTeam project
Duration9 weeks
StatusCompleted, live
Situation
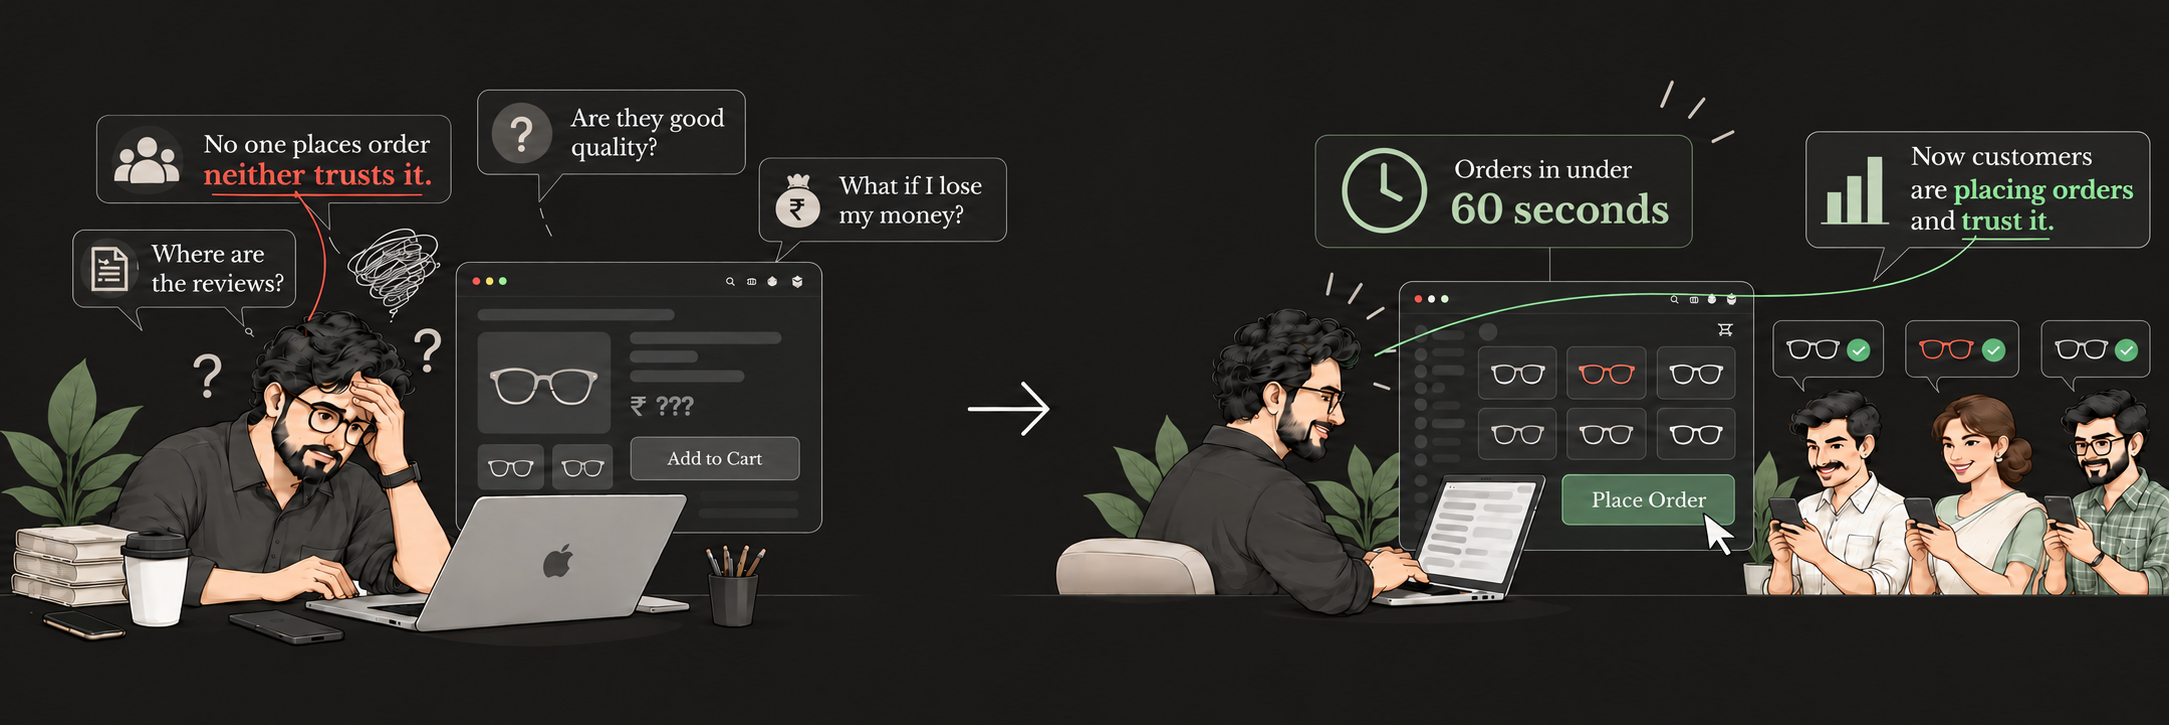
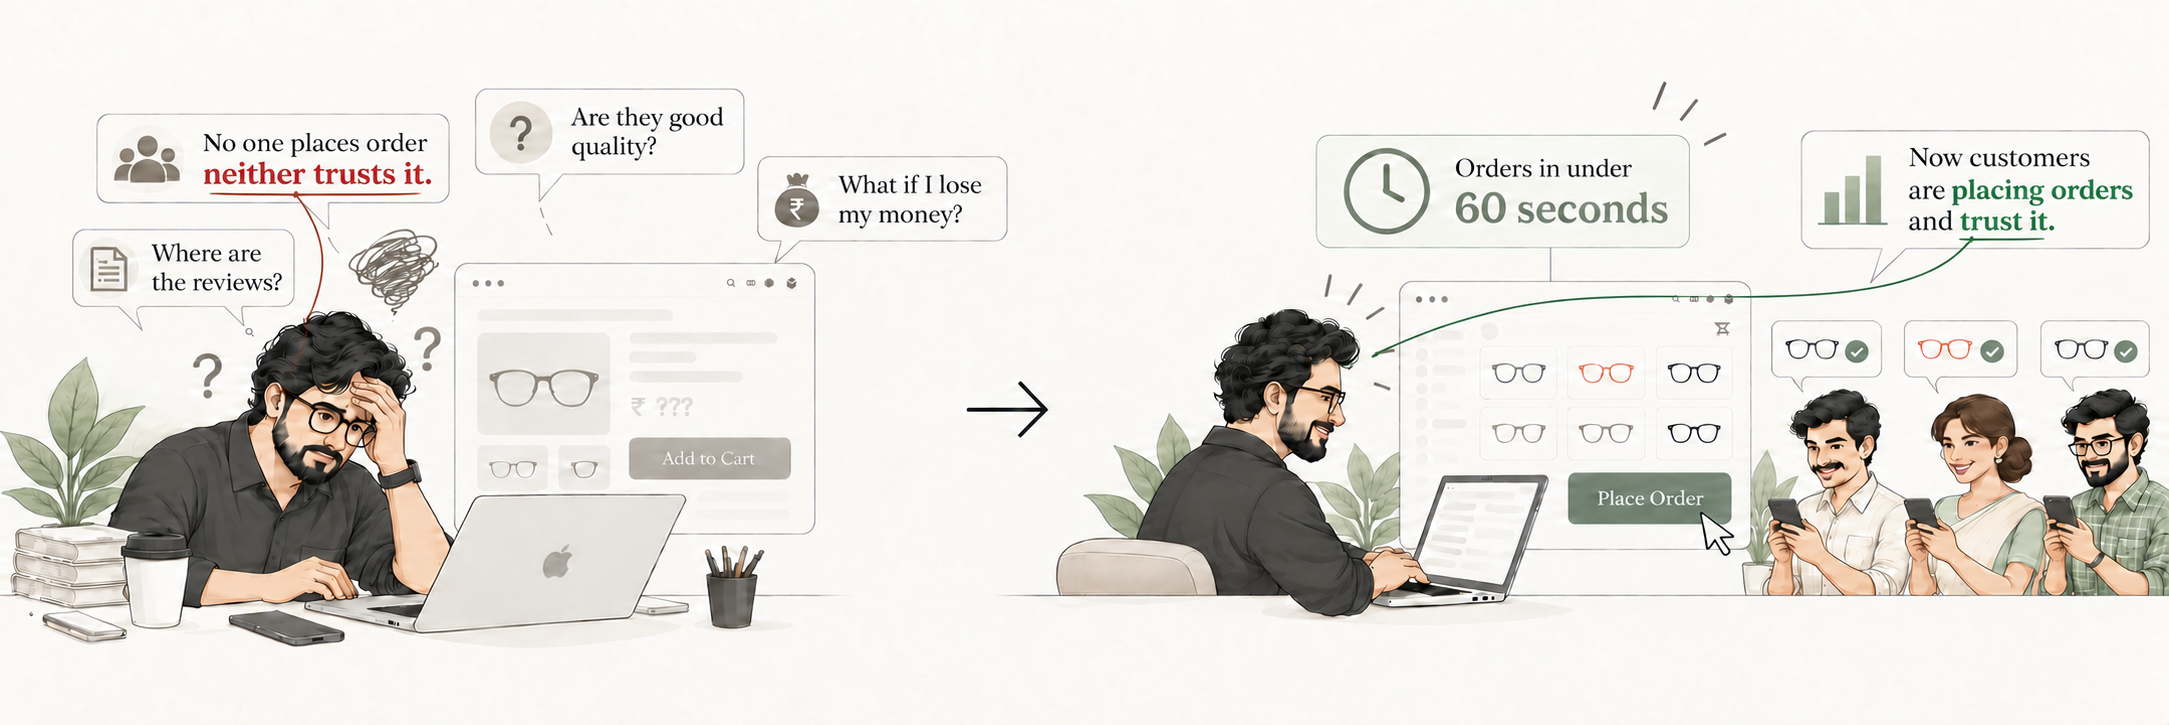
The organisation had 300+ clients, but its platform was broken and none could order from it. It was the face of the company, yet carried no trust, no design system and an outdated brand. Users were store owners aged 20 to 50 in Pune, Nashik and Tier 2–3 Maharashtra, with moderate-to-low digital comfort.
Task
Deliver a platform where clients browse, order stock, make large transactions, track their paid and pending ledger, track orders and raise returns, in four variants for four client categories. Build a brand personality that attracts new clients.
Action
Audited the ordering flow with rural target users: none could complete an order.
Ran call and video interviews to find root causes. Research involved 20 participants.
Competitive analysis of 10 brands, then gap analysis and a brand-personality decision.
Prototyped, tested, iterated and launched. Simplified hierarchy, user flows, visual design, product descriptions and quantity selection. Built a scalable system with 250+ components.
Result
Before: no target user could complete an order in the audit. After: all five rural test users completed purchase and checkout unassisted, in under 60 seconds.
Learning
For rural users, visual hierarchy mattered more than label wording. They navigate by it, even though they understand CTA labels.
5/5
completed purchase unassisted
<60s
to complete an order
<3s
to understand navigation and find products
4/5
user confidence rating
Six parts, full story
History
Why it started
The platform was fully broken: 300+ clients could not order.
Lead acquisition, market positioning, brand reputation and trust were compromised; the brand was outdated, mismatched and had no design system.
The need: make the platform work, restore credibility and attract potential clients.
Geography
Who
Users: optical-store and showroom owners, ages 20–50, across Tier 1, 2, 3 cities and rural places.
Where: Mumbai, Pune, Nashik and Tier 2–3 Maharashtra.
Devices: phone and desktop. Digital comfort: moderate to low. Market: optical industry.
Physics
Flow
Main task: complete a purchase; also returns and tracking, inventory and new-stock visibility.
Friction: broken hierarchy, inconsistent UI, accessibility problems and clutter. Simplified hierarchy, flows, visual design, product description and quantity selection.
Chemistry
Trust
Before: serious doubt about genuineness, navigation confusion, doubts about product/service value and perceived spam.
Goal: trust, credibility and stability.
Design response: trust-focused color psychology, professional copy, polished layouts and no jarring animation.
Biology
Behavior
Observed: platform abandonment; when stock ran out, users called instead of browsing and placed orders by phone.
Desired behavior: make purchases on the platform.
Feedback: show the status of each step.
Mathematics
Proof
20 research participants · 10 brands in competitive analysis
5/5 low-digital-usage target users completed the purchase without help; business impact: purchase in <60s.
Navigation understanding and product discovery: <3s. Confidence: 4/5.
Quote: Narottam Shukla, Operations Head — “UI/UX Expert.” Validate returns, page engagement and lead acquisition.
Source: moderated usability test with 5 low-digital-usage target users, plus pre-redesign audit. Small sample, reported as tested.
Still to validate: returns completion, page engagement, lead acquisition.
Key screens
Home · DesktopHome · MobileProduct listing · Desktop
02 · D2C Ecommerce
Twenty2
A bold storefront for a premium optical house brand that had no orders and no trust.
RoleUI/UX Designer
TeamTeam project
Duration2–3 weeks
StatusCompleted, live
Situation
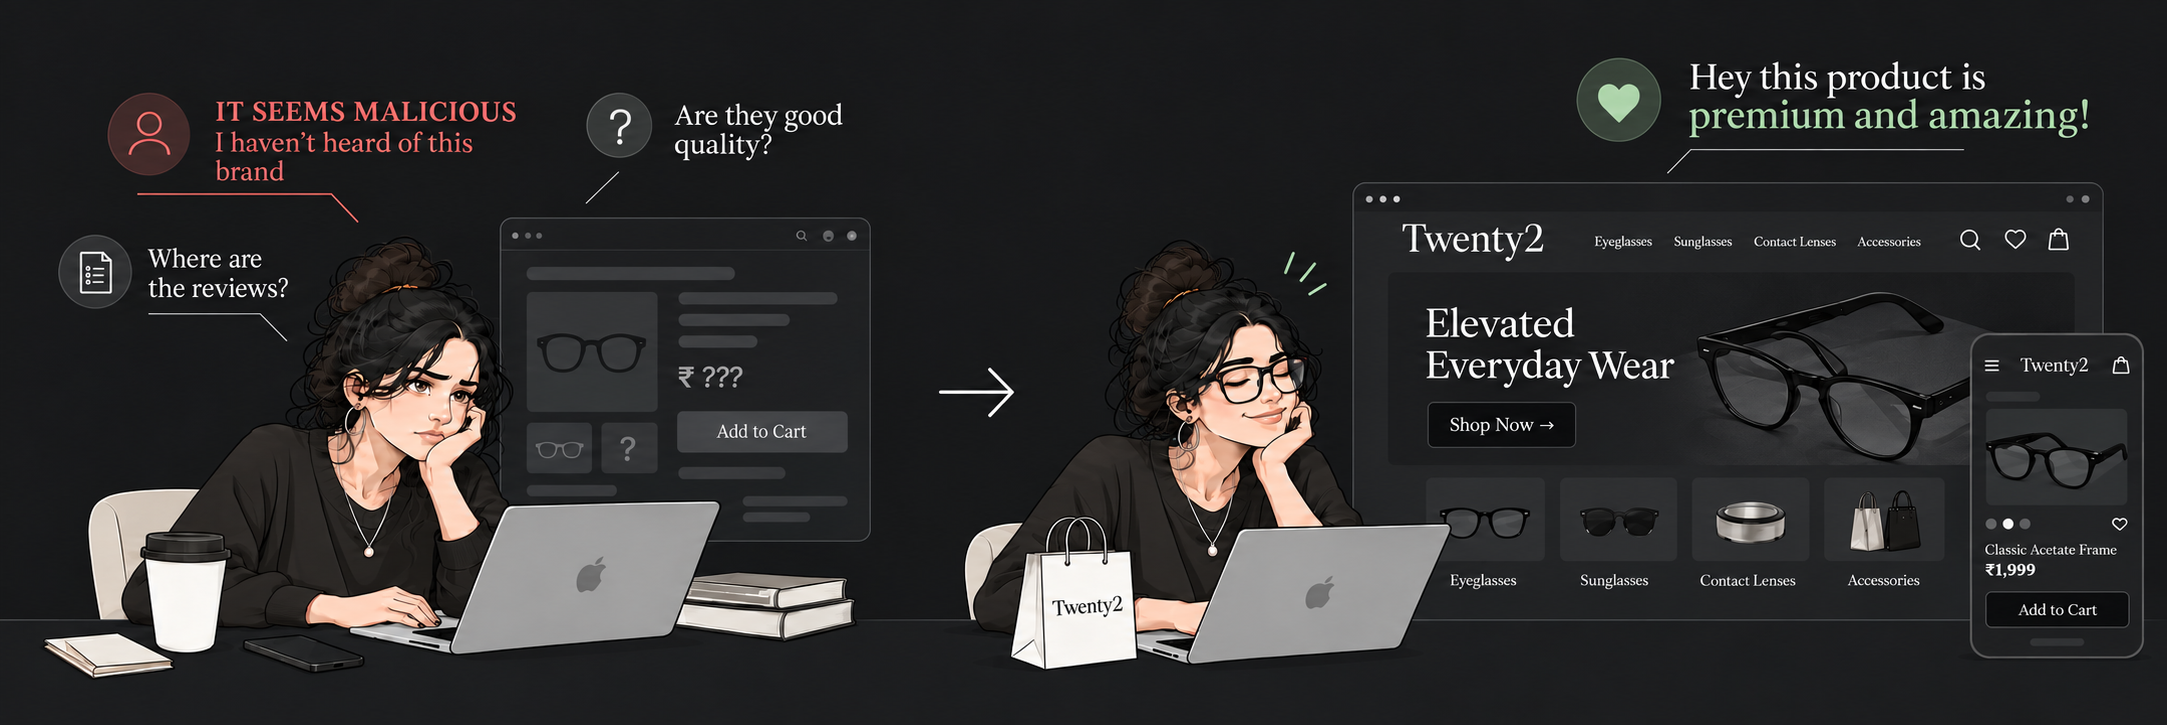
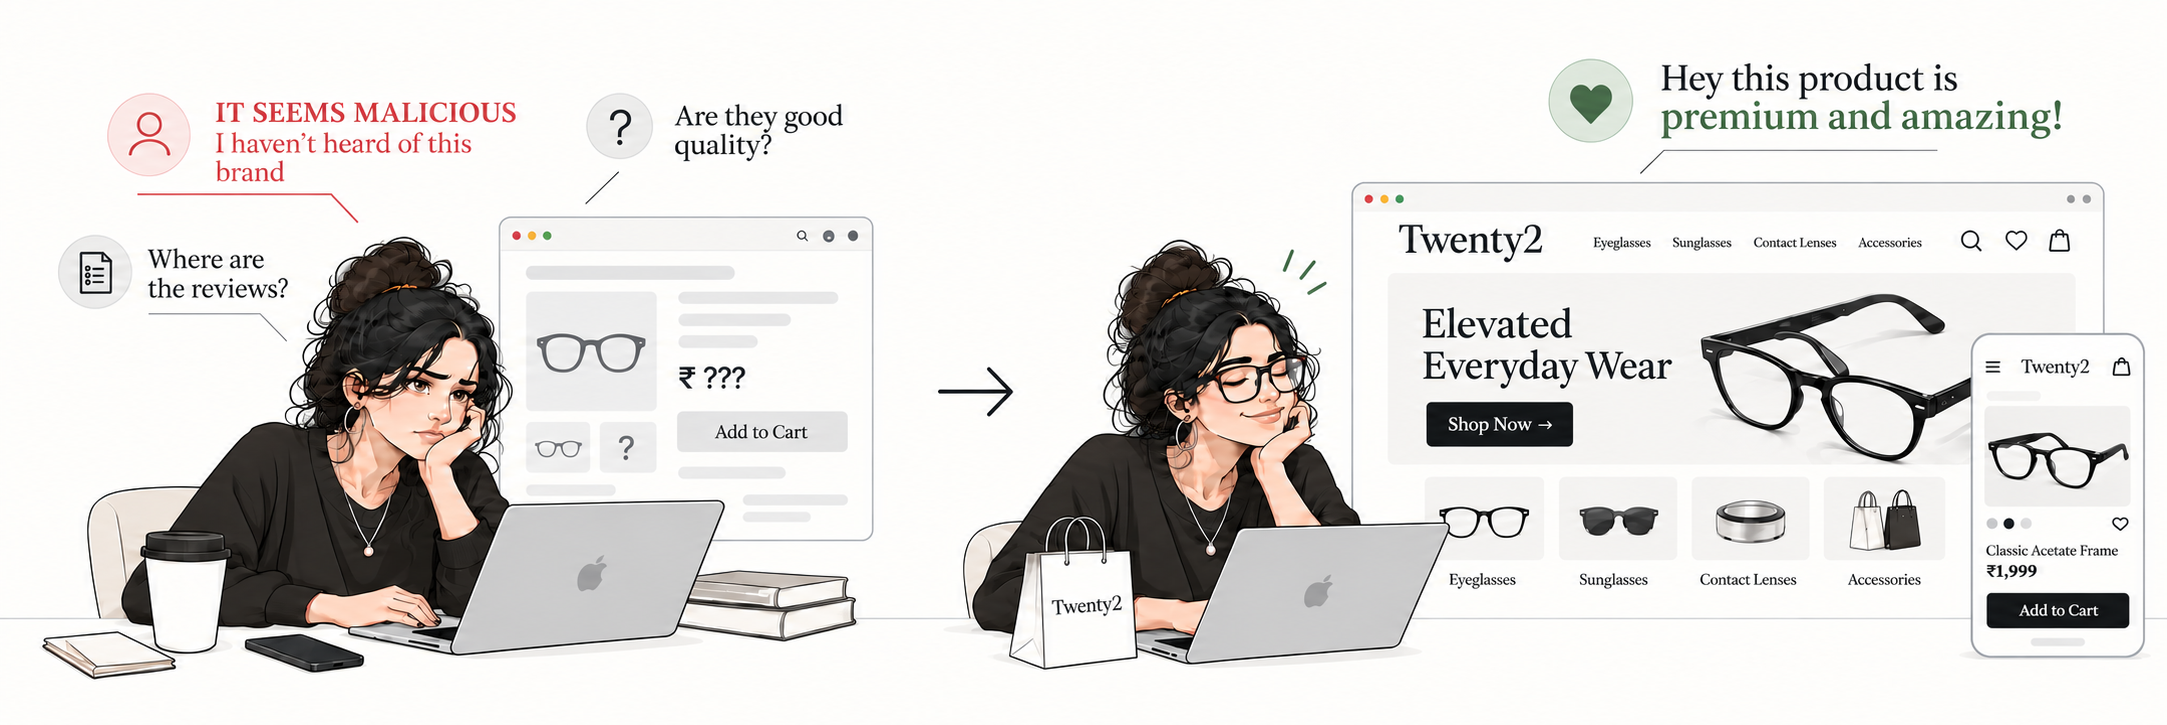
The organisation's most premium brand had received no orders. Visitors couldn't trust the platform, and a disrupted identity didn't speak to its audience: urban, fashion-led people aged 18 to 40s in Mumbai.
Task
Build a D2C platform whose personality shows what the brand is and who it's for, and remove the fear that the store might be spam or a financial risk.
Action
User flow, brand personality and visual identity.
Moodboarding, sketching and generated imagery, then a prototype.
Deep black and electric yellow for contrast and energy, with playful, bold type and copy, and dynamic motion.
Simplified purchase flow and collection discoverability.
Result
About two weeks after making it, the platform started getting orders. Stakeholders approved the work.
~2 wks
from making the platform to first orders
3
stakeholder interviews
10+
brands in competitive analysis
4/5
user confidence rating
Six parts, full story
History
Why it started
The organization was dissatisfied with an unserving, unrefined and unreliable platform.
The premium brand identity felt cramped and did not connect with its target audience; shoppers could not perceive product value.
There were no orders. The need was to revive the value proposition and make the platform monetize.
Geography
Who
Users: bold, fashion-oriented urban population; college students, working professionals, fashion and media, ages 18–40s.
Friction: broken hierarchy, inconsistent UI, accessibility problems and clutter. Simplified purchase flow, visual identity, discovery, product value proposition, trust and perceived brand value.
Chemistry
Trust
Before: the platform felt ingenuine; shoppers feared losing money and did not trust it.
Goal: high-end fashion, bold, funky, premium, trustworthy and attractive.
Design response: deep black and electric yellow, playful bold typography and copy, creative layouts, high-end fashion imagery and dynamic animations.
Biology
Behavior
Observed: no retention or discovery; visitors landed, doubted the platform and dropped off.
Desired behavior: purchase.
Feedback: improve visual design for instant product discovery and communicate perceived value through a refined platform.
Mathematics
Proof
3 stakeholder interviews · 10+ brands in competitive analysis
Result: stakeholder approvals; orders started about two weeks after launch. Confidence: 4/5.
Quote: CEO, Salecha Lifestyles — “You are fully immersed in it.” Product discovery was a focus; the errors listed were drop-off and loss of trust.
Still to measure: page engagement.
Source: stakeholder interviews and approvals; order timing observed. Page engagement and order volume still need to be measured.
Still to validate: page engagement, and order volume figures to quantify the result.
You are fully immersed in it.CEO, Salecha Lifestyles LLP
Key screens
Home · DesktopHome · MobileAccessories & Footer · Desktop
03 · SaaS Dashboard
ProFIT
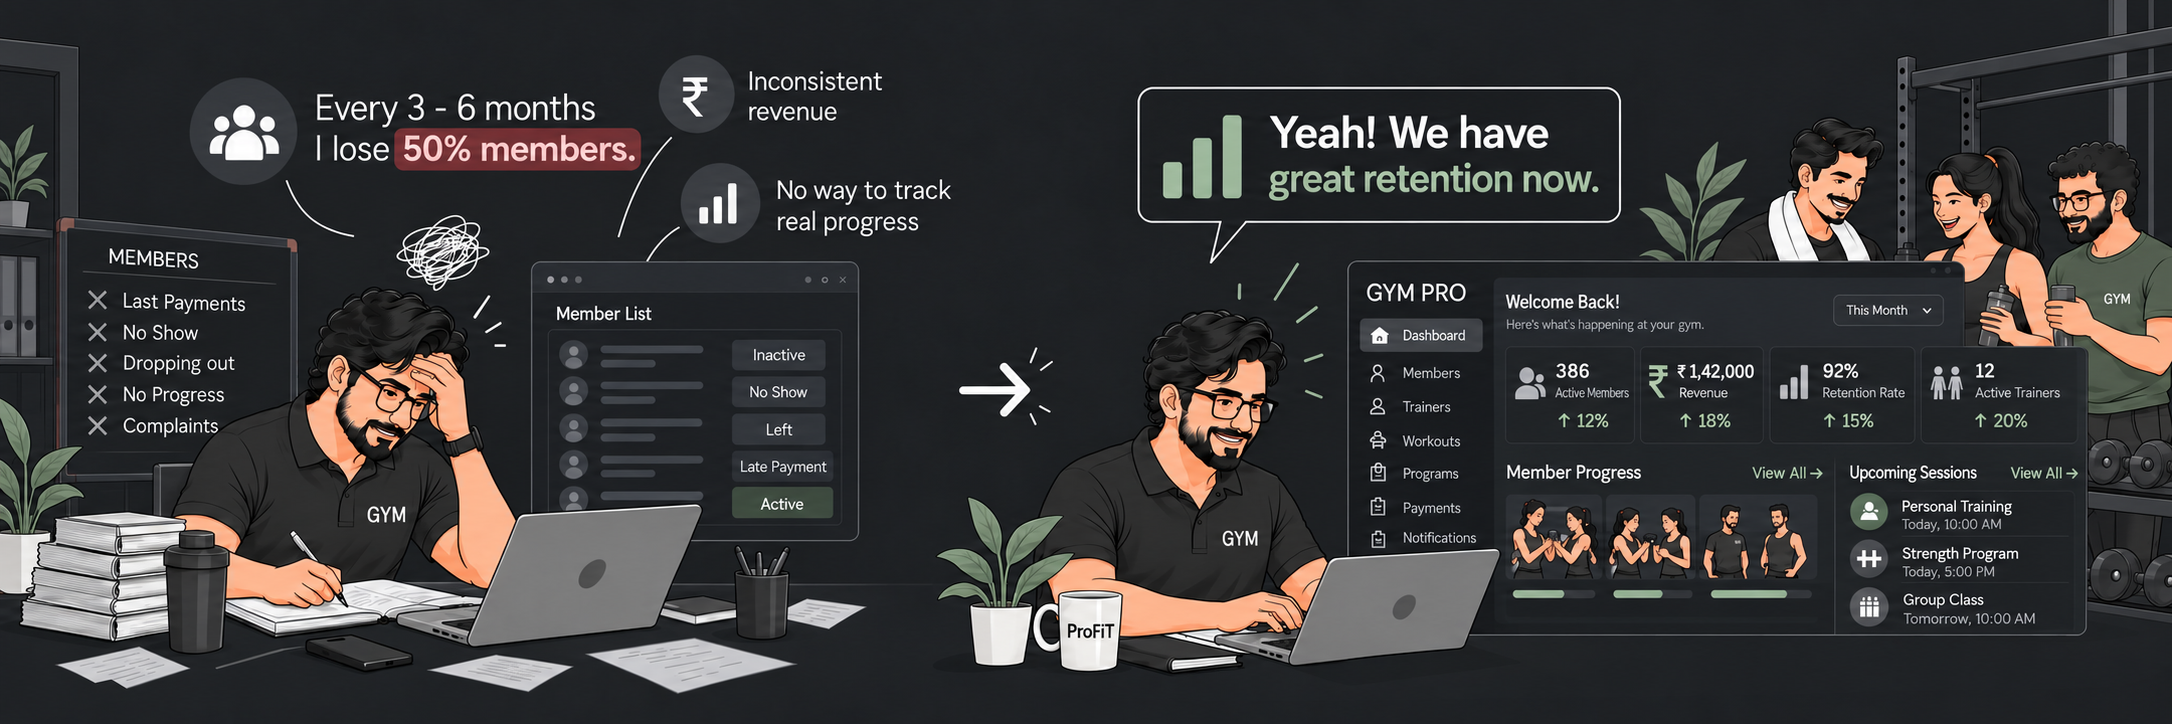
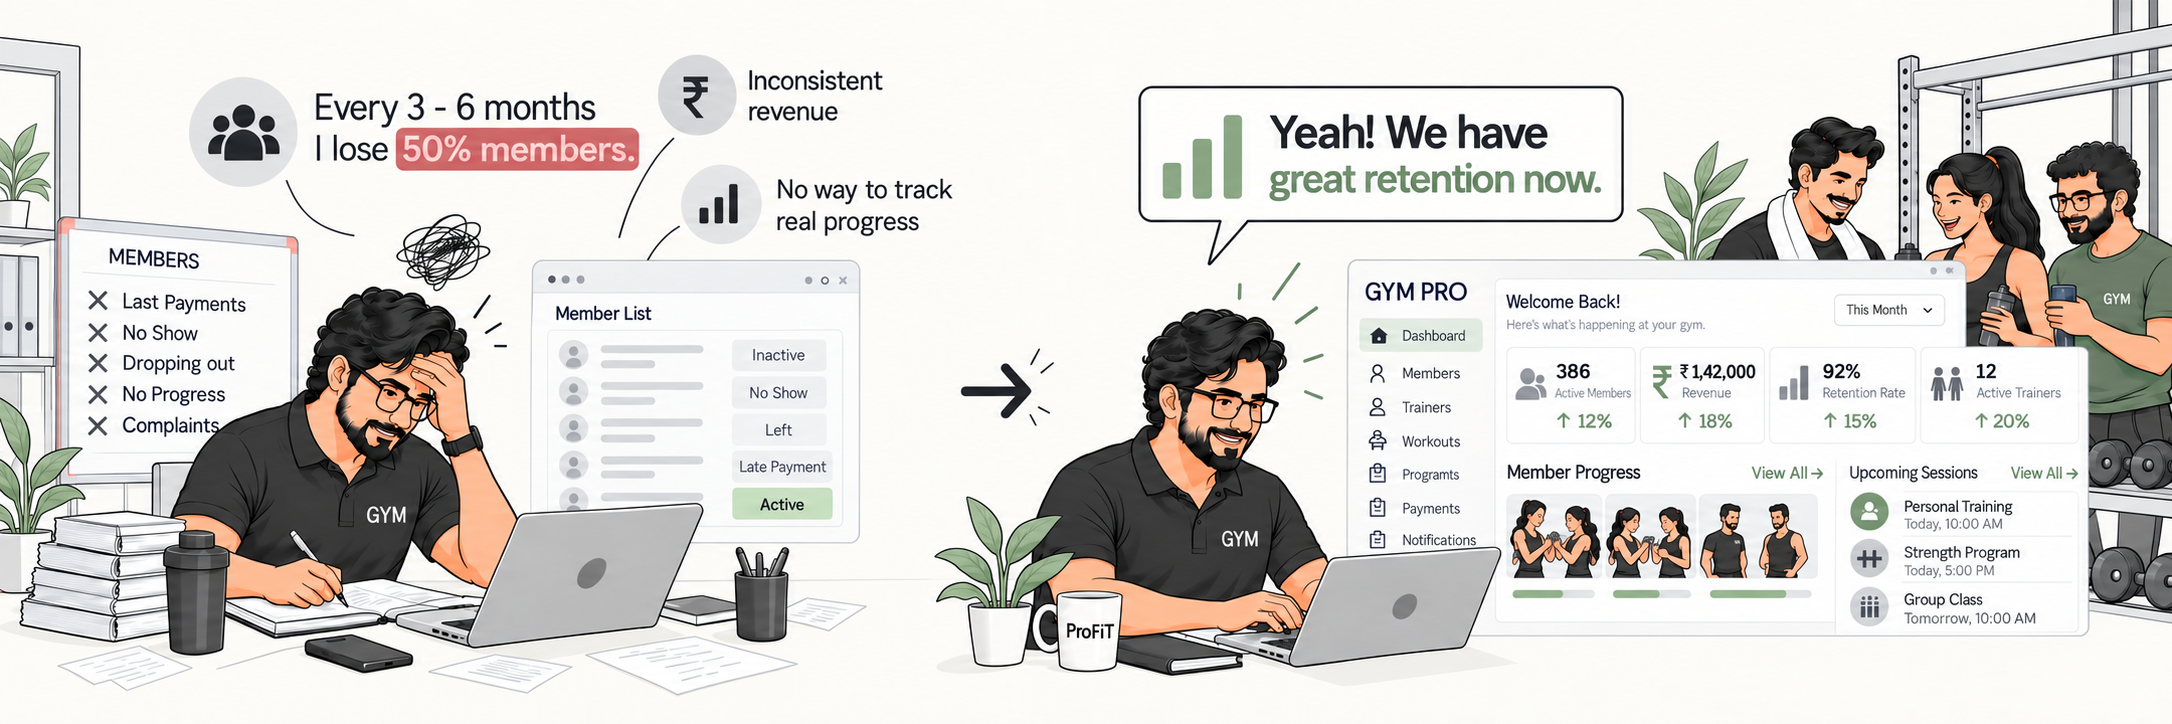
An AI-powered management system that shows gyms which members may leave, and why, before the loss happens.
RoleUI/UX Designer
TeamSolo
Duration1 week
StatusCompleted
Situation
Field research across three centres found that centres with strong management faced little to no threat of member loss. Yet teams lacked a smart system to surface dissatisfaction patterns and give staff a clear way to respond. A broader drop-off figure appears in project notes, but its timeframe and source could not be verified, so it is not used as a project result.
Task
Design a tool that scores satisfaction across management, staff, trainers and infrastructure, forecasts institute-wide and per-member leaving risk through pattern recognition, and points to the cause so owners can act early.
Action
Field visits to top gyms in the region to understand what causes churn and why.
Root-cause analysis, then design thinking with convergent and divergent methods.
Designed a dashboard with direct access to follow-ups, trainer patterns, satisfaction scores and live threat signals.
Result
Three participants across three centres completed their assigned test flows. At Diamonds Gym, the participant reached at-risk members but did not fully understand the output, revealing a need to clarify the risk explanation. The manager said the experience was better than their current system.
3/3
participants completed assigned test flows
5–6s
to find at-risk members at Force Gym
8–9s
to find the lowest-impact trainer at Force Gym
4/5
user confidence rating
Six parts, full story
History
Why it started
There was no smart assistant to recognize dissatisfaction patterns or show pain points before damage occurred.
The brief reports 40–60% member loss in the first 9–18 weeks; centres faced financial threat and members became dissatisfied and unmotivated.
Why it mattered: recurring member loss and dissatisfaction. Trigger: the continuous loss of members.
Geography
Who
Users: fitness centres and institutes; owners, managers, trainers and members. The brief lists ages 18–60 for owners.
Where: metropolitan cities. Market: gyms and fitness.
Devices: desktop and phone. Digital comfort: moderate to high.
Physics
Flow
Main journey: review leaving percentage, threat analysis and dissatisfaction patterns—from the whole institute down to an individual member.
Tasks: review management gaps, satisfaction drivers and pain points; act before damage occurs.
Paths: Home → Follow-ups → Leaving percentage; Home → Trainers → Patterns; Home → Satisfaction Score; Home → Live Threat. Friction: no smart pattern-recognition tool.
Chemistry
Confidence
Before: “This is not solvable.” The core feeling was helplessness.
Need: reveal threat patterns and likely causes so teams can take preventive action before losses occur.
The brief leaves the final UI emotion and trust issue unspecified.
Biology
Behavior
Observed loop: unable to measure dissatisfaction → no resolution → member leaves → repeat.
Desired change: pinpoint the problem and score the current position, then follow preventive and resolution steps.
Feedback: satisfaction score, current threats and pain points, management contribution to profit, and areas to improve.
Mathematics
Proof
5 research participants · 3 centres · 3 usability-test participants
3/3 completed key flows. Users identified at-risk members, understood probable reasons and took follow-up action. Confidence: 4/5.
Force Gym: risk members 5–6s; lowest-impact trainer 8–9s. Diamonds: members 6–7s; trainer 9s. Risk output was not fully understood.
Quotes: Force manager answered “Yes” when asked if it helped; Diamonds manager said, “It's better than our current system.” Intended impact: improve retention and predictable recurring revenue, and prevent financial loss and repeated member drop-off. Still to validate: retention, churn, follow-up response, satisfaction, revenue and membership growth.
Honest note: At Diamonds Gym, the participant found members in 6–7 seconds and the lowest-impact trainer in 9 seconds. They reached the at-risk members but did not fully understand the output, so the risk explanation is the next iteration.
Sources: 5 research participants across 3 centres; 3 usability tests, one per centre. The project notes cite BMJ Open and a Japanese sports-medicine study for member drop-off context, but full citations and consistent time windows were not supplied.
Still to validate: retention rate, churn reduction, follow-up response rate, satisfaction score and revenue impact.
It's better than our current system.Aditi, centre manager, Diamonds Gym